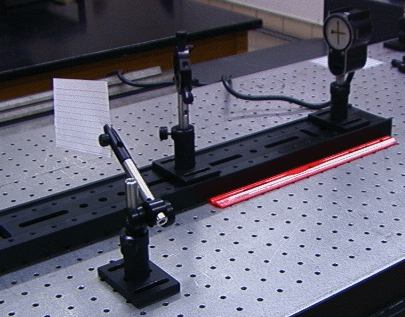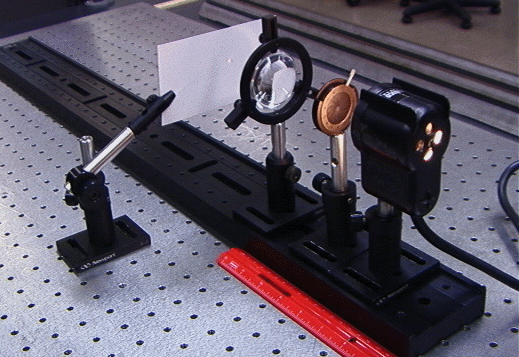

This laboratory has two parts. For the first part students use lenses will to observe more geometrical aberrations and chromatic aberrations. For the second part students will use a He-Ne laser (λ = 633 nm) and a high-speed silicon detectors to measure the power of the laser light falling onto the detector, when the laser beam is not attenuated and when it is a attenuated by passing through different neutral density filters.
|
Laser Assembly | |
|
Beam Steering Assemblies | |
|
Lens Chuck Assemblies | |
|
Target Assemblies | |
|
Lens Kit | |
|
Incandescent Light Source | |
|
Apertures | |
|
Meter Stick, Ruler | |
|
Index Cards | |
|
Detectors | |
|
Power Meter |
![]()
Part 1:
Astigmatism
Astigmatism appears when extended off-axis objects are imaged with spherical lenses.

Place the incandescent light bulb with a diffuser and a crossed arrow target onto the optical rail. Make sure the lines of the cross are vertical and horizontal. Position a f = 100 mm plano-convex lens approximately 25 cm from the front of light source (the object). Let a convex side of the lens face the light source to minimize spherical aberrations. Find the image of the crossed arrows on a screen and note the position of the screen. Now rotate the lens by ~45 degrees. Find the position of the screen when the vertical and when the horizontal line is in focus. Fill in the table below. Comment on your results.
| image position 0 degrees |
vertical line image 45 degrees |
horizontal line image 45 degrees |
Field curvature
When flat objects are imaged with spherical lenses, all transverse points on the image are in focus at the same time on a curved surface instead of a flat plane. Attach a small piece of transparent ruler to the front of the light source. Position the f = 38.1 mm or the f = 50.2 mm plano-convex lens so that image magnification is greater than unity. Let the convex side of the lens face the light source.

Do not tilt the lens. Concentrate on the millimeter tick marks of the image. Bring the ones in the center into focus. Then bring the ones farthest to the side into focus. Note the positions of the screen in each case. Comment on your results.
| screen position center in focus |
screen position sides in focus |
Distortion
Distortion results when image magnification is a function of radial distance. Look at various images of parallel lines on a piece of millimeter paper with the f = 50.2 mm plano-convex lens. Hold the lens at various distances from the paper creating both virtual and real images. Describe the distortions you can observe.
Chromatic aberration
Chromatic aberrations are a consequence of the wavelength-dependent refractive index of the glass of the lens. Different wavelengths come to a focus at slightly different distances.

Let the light from the incandescent light source pass through an adjustable aperture (the object) and then pass through a f = 38.1 mm converging lens. Make the aperture as small as possible. Image the aperture so that image magnification is approximately unity. Move the screen back and forth around the focus and observe the colors which appear on the periphery of the image. How does the focal length vary as a function of wavelength?
![]()
Part 2:
| Mount the laser onto the breadboard. Turn it on and leave it on, so that it warms up and stays warm. Use a beam stop to block the beam from traveling across the room. | |
| Set up the Tektronix TDS 210 Digital Oscilloscope. Perform the functional check described on page 5 of the TDS-200 series user manual. If you are not familiar with this scope, read through “Operating Basics”, pages 23 – 36 in the user manual. | |
| Position the Thorlabs
DET110 high-speed silicon detector so that the laser beam hits the
photodiode. The photodiode is an ordinary diode in which the diode
junction is exposed to light. Place the filter
wheel with the neutral density filters between the laser and the detector so
that the laser beam passes through two empty holes.
| |
| Connect the output of the DET110 to the input channel 1 of the scope,
using a 50 Ω cable and a tee with a 50 Ω
terminator. Press the Vertical Menu button for channel 1 and set the
probe attenuation to 1X. (See page 8, user manual.)
| |
| Turn the detector on and measure the output voltage with the oscilloscope.
The photocurrent I flowing through the 50 Ω resistor is proportional to the
power P of the light illuminating the photodiode. I = KPD P, The proportional constant KPD is called the responsivity of the photodiode. The voltage drop across the resistor displayed by the oscilloscope is V = IRload. Use V = P KPD(λ) Rload to find the laser power P falling onto the detector. Determine KPD at 633 nm from the graph below. Rload = 50 Ω.
| |
| The neutral density filters provide uniform attenuation over a broad
spectral range. The "optical density" is defined by
ND = log10(1/T), or T = 10-ND. Here T is the transmittance. Place filters with different optical densities between the laser and the detector and measure the power P falling onto the detector. | |
| Fill in the table below. |
| ND | Detector Voltage V |
V/VND=0=P/PND=0 (measured) | P/PND=0 (expected) |
| 0 | 1 | 1 | |
| 0.2 | |||
| 0.3 | |||
| 0.4 | |||
| 0.5 | |||
| 0.6 | |||
| 1 |
| Plot P/PND=0 measured versus P/PND=0 (expected). Is the detector response linear? | |
| Replace the DET110 with the the Thorlab S110 power meter to measure the output power of your
laser.
Check the power meter manual, pages 6-9, for operating instructions. Compare the value for the output power measured with the power meter with the value you obtained when measuring the output power with the DET110. |
![]()
Open Microsoft Word and prepare a report using the template shown below.
| In a few words, describe the experiment. (What?) | |
| In a few words, state the objective of the experiment. (Why?) | |
| Comment on the procedure. Did you encounter difficulties or surprises? (How?) | |
| Present your results and comment on your results. |