In this laboratory students will a plano-convex lens and observe spherical aberrations and coma. Students will use the ray tracing program OSLO to model their observations. They will learn how to enter lens data into OSLO.
|
Laser Assembly | |
|
Beam Steering Assemblies | |
|
Lens Chuck Assemblies | |
|
Target Assemblies | |
|
Lens Kit | |
|
Apertures | |
|
Meter Stick, Ruler | |
|
Index Cards |
![]()
The ray-tracing program OSLO for educational use is available as a free download from Lambda Research. To make effective use of OSLO, you should be familiar with several basic concepts concerning the user interface and the basic algorithms that OSLO uses.
OSLO data can be divided into four major groups: surface data, operating conditions, preferences, and the Spreadsheet Buffer.
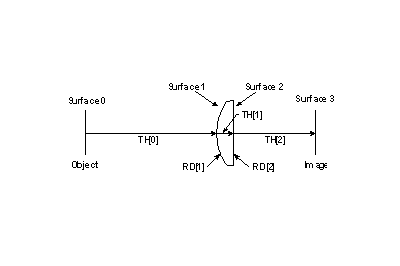
| Surface data describe the refracting and reflecting surfaces and the material in the space between the surfaces and include items such as the radius of curvature, the thickness, the type of glass, the aspheric constant, etc. Surfaces are numbered, starting with 0 for the object surface. In a normal, sequential optical system the surface numbers increase monotonically in the order that rays strike them. The most common way to enter and modify surface data is the "Surface Data" spreadsheet. | |
| Operating conditions include items that pertain to the whole optical system. They specify not only fundamental optical items such as the entrance beam radius or the object height, but also data that relate to system analysis, such as the size of grid cells in a spot diagram, or the number of rays to show on a lens drawing. | |
| Preferences are to be distinguished from operating conditions. Preferences are attached to the program, and remain the same for all lenses. Examples include the appearance of the graphics windows, number formatting, the selection of fonts, etc. | |
| The Spreadsheet Buffer is an important part of the OSLO data structure. As far as OSLO is concerned, the spreadsheet buffer is an output-only data structure, but it serves as the principal source of communication between the program and user macro commands. |
OSLO is fundamentally an interactive program. Each command is executed after it is entered and the display is updated. This means, for example, that the surface data spreadsheet is always up to date. There are a few exceptions, mostly relating to entering optimization data, but for the most part OSLO is based on an interactive model.
![]()
User Interface
The OSLO user interface is similar to that of other windows programs. The on-line help system explains how to make use of the command line, menu, toolbars, dialog boxes, sliders, graphic and text windows etc.
Data entry
OSLO is a surface-based program, which means that the objects it deals with are surfaces. If you want to work with a solid model, you must enter data that describe all the surfaces that bound the solid. An optical system is specified in OSLO as a series of surfaces that a ray intersects consecutively in passing through the system. Light enters the system traveling from left to right. The object surface is given the number 0. In a sequential system, surfaces are numbered in the order in which a ray or its extension (in the case of a virtual surface) would intercept them. The highest numbered surface is called the image surface, whether or not there is an image formed on it. The correct ordering of the surfaces is essential for lens input specification to OSLO.
Quantities that describe a surface, such as the radius of curvature and the aspheric coefficient, carry the number of the surface. Quantities that pertain to the space between two surfaces, such as the refractive index and the thickness, are assigned to the lower-numbered surface.
Nominally refracting surfaces having no refractive index change have no effect on ray trajectories, and are called dummy surfaces. A dummy surface is often used to keep track of ray data, or to establish a base coordinate system for other surfaces.
Sign conventions
The proper signs for the radius of curvature, the thickness and index of refraction are determined easily for systems that do not contain tilted surfaces. Then the following rules apply:
Sign conventions for centered systems
|
RADIUS OF CURVATURE |
The radius of curvature, or curvature of a surface is positive if the center of curvature lies to the right of the surface. |
|
THICKNESS |
The thickness separating two surfaces is positive if the next surface lies to the right of the current surface; otherwise it is negative. |
|
REFRACTIVE INDEX |
OSLO expects all refractive indices to be provided with positive signs. Reflecting surfaces are specified explicitly by the designation, rfl. |
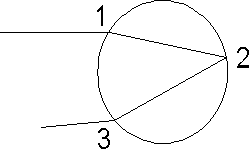
A simple example illustrates the sign conventions used for setting up optical systems. Consider a glass bead in which light enters from the left, reflects from the back edge, and then emerges from the same surface that it entered, as shown in the figure. The correct surface data for this system is shown below:
| SRF | RADIUS | THICKNESS | APERTURE RADIUS | GLASS |
| 0 | -- | 1.0000e+20 | 1.0000e+14 | Air |
| 1 | 5.000000 | 10.000000 | 4.999999 A | BK7 |
| 2 | -5.000000 | -10.000000 | 4.999999 | Reflect |
| 3 | 5.000000 | -- | 4.999999 | Air |
| 4 | -- | -- | 4.999999 S |
Surface types
OSLO provides many ways of identifying surfaces beyond direct specification. These methods fall into three groups: pickups, solves, and variables.
| Pickups pick up parameters from another surface and apply them to the current surface. This is useful, for example, in designing a system with a mirror that reflects the light back through some part of the system. The surfaces in the path back from the mirror are the same physical surfaces as in the path toward the mirror. By specifying the radii of the surfaces in the path back as pickups from those in the forward path, you guarantee they will always be identical. | |
| Solves tell the program to calculate the value of a parameter that satisfies a given condition. For example, specifying the thickness of the next-to-last surface of a lens by an axial ray height solve with height zero tells the program to calculate the thickness of this surface so that the axial ray will pass through the vertex of the image surface. This is the same as saying the image surface remains at the paraxial focus. As other surfaces change, OSLO changes the thickness of the next-to-last surface to satisfy the condition. | |
| The Variable specification (which is only applicable for directly specified items) tells OSLO it may vary the item during optimization. |
Whenever lens data is changed, OSLO retraces the axial and chief ray through the system, resolving all pickup and solve requests. The routine that does this is called lens setup.
Lens drawings
Although the main purpose of OSLO is to carry out optical design, the program contains extensive routines for making drawings of lenses that can be viewed on screen, printed as hard copy, or exported to other software in various graphical formats.
![]()
Procedure:
Spherical Aberration (Ray tracing)
Open OSLO. You will be prompted with the following options:
Choose option 1. A control screen will appear with three windows.
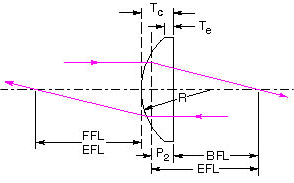
Highlight the "Surface Data" Window. All of the options on this window control the surface parameters of the optical system. You will design a plano-convex lens with a radius of 25.943 mm and thickness of 6.321 mm made of Bk7 glass. The surface data for this lens (KPX082) are taken from Newport's Web site and listed in the table below.
Bk7 Precision Plano-Convex Lenses
| Diameter (mm) |
EFL (mm) |
f/# | BFL (mm) |
FFL (mm) |
P2 (mm) |
Tc (mm) |
R (mm) |
Model |
| 25.4 | 38.1 | 1.5 | 33.06 | 38.10 | -5.03 | 7.643 | 19.690 | KPX079 |
| 25.4 | 50.2 | 1.9 | 46.03 | 50.20 | -4.16 | 6.321 | 25.943 | KPX082 |
| 25.4 | 100 | 3.9 | 96.97 | 100.00 | -3.02 | 4.585 | 51.680 | KPX094 |
When you start a new lens, the surface window has three rows. Each row represents one surface:
Your lens system has five surfaces: object, AST, lens with two surfaces, and image surface. You must add two more surfaces in order to have five surfaces. Left click the second row, labeled AST, this row will now be highlighted. Now, right click the same row and a menu will appear. By choosing the "insert after" option you will insert a surface into the row below the selected (AST) row. Repeat the process and insert another surface below the surface labeled 2. Now you have five surfaces:
Now you can enter surface data. First, highlight the cell labeled "Ent beam
radius". Enter 10 for this value (the default units are mm) and click the green check mark in the left corner. (Always finish an entry by
clicking the green check mark.) The
beam radius is the maximum distance between the outer trace rays.
Highlight "Primary waveln" and choose 0.6328 Helium-neon. (Wavelength are specified in
micrometer.)
Next, click on
the radius for the first lens surface, which is the second column of the row
labeled 2. Enter a value of 0, which will set the radius of curvature for the
second surface. This value can be both positive and negative depending on the
surface type. The next parameter in the current row is the thickness. The
thickness is the distance from the first surface to the second surface. Enter a
6.321 in this cell, which will put the next surface (surface 3) a distance of
6.321 mm from the first surface. Next, click the cell in the "glass" column for
surface 2 that says air and click Catalog, Schott, N-BK7.
Click on the radius for the second lens surface, which is the second column of the row labeled 3. Enter a value of –25.943, which will set the radius of curvature for the second surface to 25.943 mm.
Click the "draw off" button and a pop-up window will appear with a drawing of the surfaces. The aperture stop and image surface are not drawn. To change this, click the box in the "special" column of each of these surfaces. A menu will appear. Choose the "surface control" option, then the "general" option. Select the "surface appearance in lens drawing" and change the value from "automatic" to "drawn".
In the AST row click the box in the column labeled "aperture radius" and choose "direct specification" and "checked". "AK" should appear on the box. Into the thickness column of the AST row enter 10. This puts the aperture 1 cm in front of the lens. Into the aperture radius column enter 1. In the image surface (IMS) row click the button in the thickness column and click auto focus, paraxial focus. The paraxial focus is at 50.37 mm from the last lens surface. Enter this distance into table 1.
On the menu bar click lens, lens, lens drawing conditions. The last three rows have a "rays" column. Enter 0 rays in the first row and 48 in the third row. Click some of the draw buttons in the graphics widow window and examine the drawings.
In the "Surface Data" window go to the AST row. Open up the aperture stop by increasing the aperture radius to 10 mm. (In the aperture radius column of this row change the button to direct specification and then change the radius to 10.) A gain click one of the draw buttons in the lens-drawing window. Observe spherical aberration. Spherical surfaces produce a near-perfect focus only for rays close to the optic axis. Rays that are close to the axis meet at or close to the paraxial focal point, while those incident near the edge fall short by a large amount.
Watch: YouTube, Spherical Aberration
In the image surface (IMS) row click the button in the thickness column and click auto focus, minimum RMS spot size, On-axis (monochromatic). The minimum RMS spot size is called the "circle of least confusion". Enter the distance from the last lens surface to the "circle of least confusion" into table 1.
On the menu click Evaluate, Paraxial setup. The text window now lists
the data for the paraxial setup.
Click Evaluate, Spot Diagrams, Spot Size Analysis. Find the minimum spot
size at the position of the circle of least confusion and of the paraxial focus.
(Put the IMS back to the paraxial focus and do not find the best focus when
calculating the spot size at the position of the paraxial focus.)
Enter the spot sizes into table 1.
In OSLO, turn the lens around so that the convex side faces the aperture and find the distances from the last lens surface to the location of paraxial focus and the circle of least confusion and the spot sizes for a 1mm and a 10 mm aperture. Enter these data into table 1.
Comment on your results.
Spherical Aberration (Experiment)
| Produce a collimated beam of light by expanding the laser beam with the Galilean beam expander. Construct the beam expander as in lab 2. Expand the beam to a diameter between 1 and 2 cm. Use a 2 inch convex lens. | |
| Position the adjustable aperture, adjusted to radius of ~1 mm, and the f = 50.2 mm plano-convex lens (KPX092) in the beam path as close to each other as possible, with the aperture facing the light source and the plane side of the lens facing the aperture. | |
| Find the distance from the last lens surface to the location of the paraxial focus, where a very small light spot is obtained, and place a target assembly holding an index card at the paraxial focus. Estimate the radius of the beam at the paraxial focus. Enter those data into table 1. | |
| Remove the aperture and observe how the light rays begin to miss the paraxial focus, forming a much broader circle. Translate the screen to find the smallest possible light spot, known as the circle of least confusion. | |
| Find the distance from the last lens surface to the location of the circle of least confusion and estimate the radius of the beam at that location. Enter those data into table 1. | |
| Repeat the experiment with the lens turned around, so that the convex side faces the aperture. Enter your data into table 1. | |
| Comment on your results. |
Table 1
| distance last lens surface to paraxial focus |
distance last lens surface to circle of least confusion |
RMS spot size
|
|
| Ray tracing (flat side facing beam) |
|||
| 1 mm aperture | |||
| 10 mm aperture | |||
| Ray tracing (curved side facing beam) |
|||
| 1 mm aperture | |||
| 10 mm aperture | |||
| Experiment (flat side facing beam) |
|||
| 1 mm aperture | |||
| no aperture | |||
| Experiment (curved side facing beam) |
|||
| 1 mm aperture | |||
| no aperture |
![]()
Coma (Ray tracing)
Leave the flat side of the lens facing away from the object. To observe coma, change the field angle in the surface data window to 20 degrees. In the graphics window choose spot diagram and examine the "graphic spot diagram analysis". Vary the aperture size and observe coma in the system. Coma aberrations degrade the image of an off-axis object point. The point is imaged to a blob, whose shape resembles that of a comet tail. Describe the image.
Watch: YouTube, coma aberration
Coma (Experiment)
Use the same setup, as in your last experiment. Let the convex side of the lens face the aperture, then and rotate the lens approximately 20 - 30 degrees. You may have to re-center the lens. Place a target assembly holding an index card at the paraxial focus. Vary the aperture size and observe how the image changes. Describe the image.
![]()
Open Microsoft Word and prepare a report using the template shown below.
| In a few words, describe the activity and the experiment. (What?) | |
| In a few words, state the objective of the activity and the experiment. (Why?) | |
| Comment on the procedure. Did you encounter difficulties or surprises? (How?) | |
| Present your results and comment on your results. Address everything in blue font. |